plot#
- FDApy.visualization.plot(data, labels=None, colors=None, ax=None, **plt_kwargs)[source]#
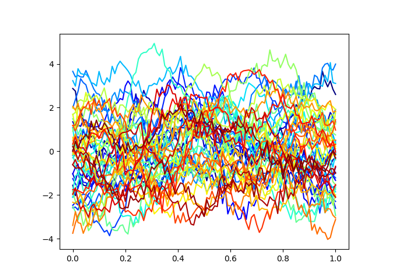
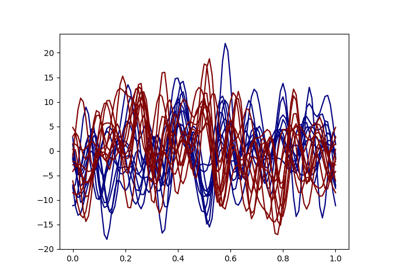
Plot univariate functional data.
Generic plot function for DenseFunctionalData, IrregularFunctionalData and BasisFunctionalData objects.
- Parameters:
data (DenseFunctionalData | IrregularFunctionalData | BasisFunctionalData) – The object to plot.
labels (ndarray[Any, dtype[float64]] | None) – The labels of each curve.
colors (ndarray[Any, dtype[float64]] | None) – Colors used for the plot. If colors is None, it uses the jet colormaps from the matplotlib library by default.
ax (Axes | None) – Axes object onto which the objects are plotted.
plt_kwargs – Keywords plotting arguments.
- Returns:
Axes objects onto the plot is done.
- Return type:
Axes
Examples using FDApy.visualization.plot#

Representation of univariate and dense functional data

Representation of univariate and irregular functional data


Smoothing of dense one-dimensional functional data

Smoothing of dense two-dimensional functional data


Simulation of clusters of univariate functional data