Note
Go to the end to download the full example code.
Representation of univariate and dense functional data#
Examples of representation of univariate and dense functional data.
# Author: Steven Golovkine <steven_golovkine@icloud.com>
# License: MIT

# Load packages
import numpy as np

from FDApy import DenseFunctionalData
from FDApy.representation import DenseArgvals, DenseValues
from FDApy.visualization import plot
The representation of dense functional data#
We are showing the building blocks of the representation of univariate and
dense functional data. To define a FunctionalData object, we need a set
of argvals (the sampling points of the curves) and a set of values
(the observed points of the curves). The sampling points of the data are
defined as a dictionary where each entry is a npt.NDArray that represents
an input dimension (one entry corresponds to curves, two entries correspond
to surface, …). The shape of the array of the first dimension would be
\((m_1,)\), the shape of the array of the second dimension would be
\((m_2,)\) and so on. Curves will thus be sampled on \(m_1\) points,
surface will be sampled on \(m_1 \times m_2\), etc. The values of the
functional data are defined as an npt.NDArray. The shape of the array is
\((n, m_1, m_2, \dots)\) where \(n\) is the number of curves in the
sample.
For unidimensional functional data#
First, we will define unidimensional functional data. We consider a hundred sampling points and two observations.
argvals = np.linspace(0, np.pi, num=100)
X = np.array([np.sin(2 * np.pi * argvals), np.cos(2 * np.pi * argvals)])

fdata = DenseFunctionalData(
    argvals=DenseArgvals({"input_dim_0": argvals}), values=DenseValues(X)
)

_ = plot(fdata)

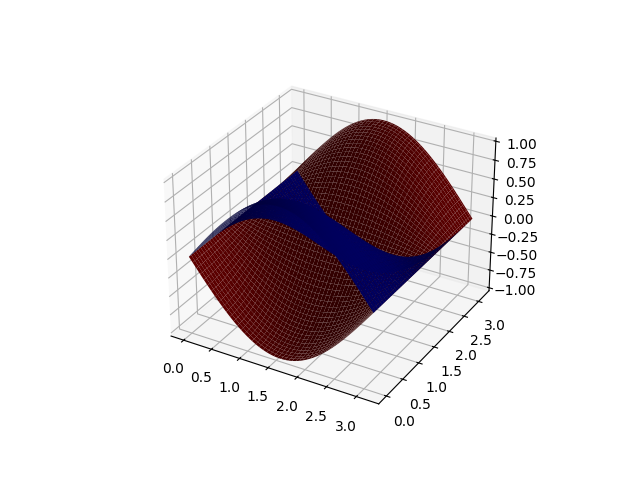
For two-dimensional functional data#
Second, we will defined two-dimensional functional data. We consider a hundred sampling points from both dimensions and two observations.
argvals = np.linspace(0, np.pi, num=100)
X = np.array(
    [
        np.outer(np.sin(argvals), np.cos(argvals)),
        np.outer(np.sin(-argvals), np.cos(argvals)),
    ]
)

fdata = DenseFunctionalData(
    argvals=DenseArgvals({"input_dim_0": argvals, "input_dim_1": argvals}),
    values=DenseValues(X),
)

_ = plot(fdata)
We could use this representation for whatever data dimension. The plotting is however not easy for data with dimension higher than two.
Total running time of the script: (0 minutes 0.679 seconds)