Note
Go to the end to download the full example code
Smoothing of dense one-dimensional functional data#
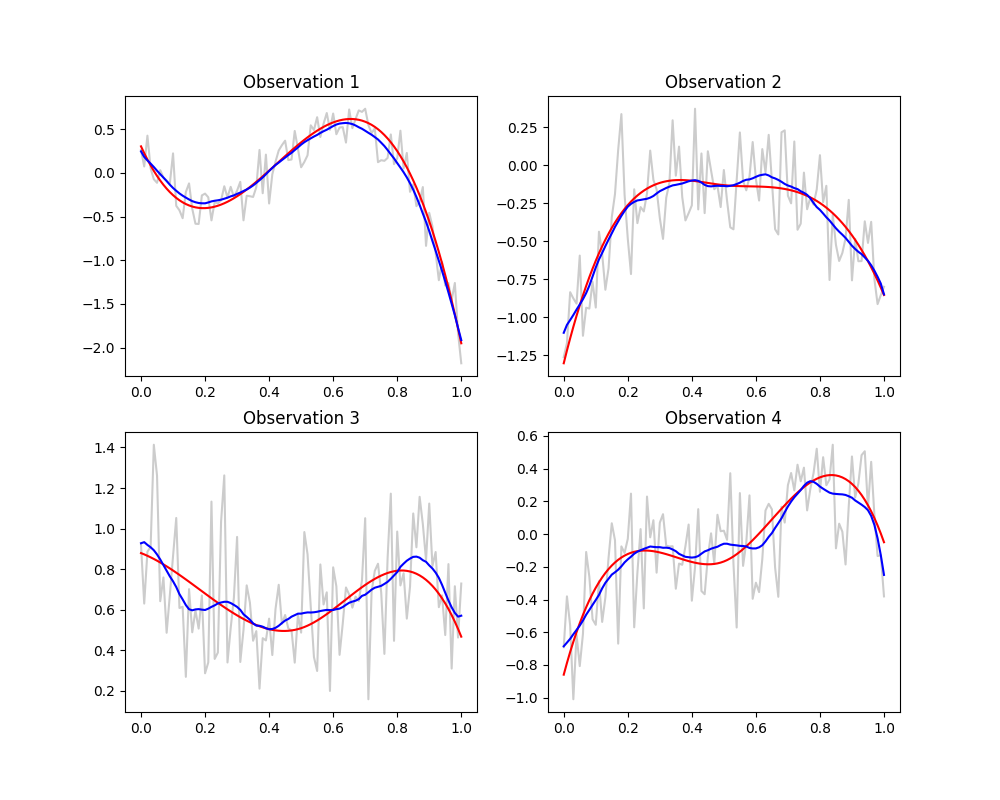
Examples of smoothing of univariate and dense functional data.
# Author: Steven Golovkine <steven_golovkine@icloud.com>
# License: MIT

# Load packages
import matplotlib.pyplot as plt
import numpy as np

from FDApy.simulation.karhunen import KarhunenLoeve
from FDApy.representation.argvals import DenseArgvals
from FDApy.visualization.plot import plot

# Set general parameters
rng = 42
n_obs = 4

# Parameters of the basis
name = 'bsplines'
n_functions = 5


kl = KarhunenLoeve(
    basis_name=name, n_functions=n_functions, random_state=rng
)
kl.new(n_obs=n_obs)

# Add some noise to the simulation.
kl.add_noise(0.05)

# Smooth the data
points = DenseArgvals({'input_dim_0': np.linspace(0, 1, 101)})
kernel_name = "epanechnikov"
bandwidth = 0.1
degree = 1

fdata_smooth = kl.noisy_data.smooth(
    points=points, kernel_name=kernel_name, bandwidth=bandwidth, degree=degree
)


fig, axes = plt.subplots(2, 2, figsize=(10, 8))
for idx, ax in enumerate(axes.flat):
    plot(kl.noisy_data[idx], colors='k', alpha=0.2, ax=ax)
    plot(kl.data[idx], colors='r', ax=ax)
    plot(fdata_smooth[idx], colors='b', ax=ax)
    ax.set_title(f"Observation {idx + 1}")

# Show the plot
plt.show()
Total running time of the script: (0 minutes 0.369 seconds)